GraphQL API
A basic understanding of GraphQL is helpful to understand this document, as we use concepts and vocabulary from the broader ecosystem. For a good primer on the subject, see the Introduction to GraphQL.
Basic GraphQL structure
-
Query: At its core, a GraphQL query is about asking or 'querying' for specific fields on objects. The query is structured like a JSON object, but without the values. This structure lets you specify exactly which data you want to fetch from the server.
-
Fields: In a GraphQL query, you specify a set of fields within braces. Each field corresponds to a piece of data you want to fetch.
-
Nested Fields: Fields can also be nested, allowing you to fetch related data. For example, if you have a user, you can fetch the user's name and, within the same query, fetch a list of the user's friends and their names.
Example
Imagine you have a user object and you want to fetch the user's name and email, along with the names of their friends. A basic GraphQL query might look like this:
query {
  user(id: "1") {
    name
    email
    friends {
      name
    }
  }
}
In this example, query is the operation type, user is the field on the root type, and name, email, and friends are fields on the user type. The id: "1" is a parameter passed to the query, specifying which user to fetch.
You can find more examples of GraphQL core concept in the section GraphQL at Powerhouse.
Analytics query structure
In the GraphQL query for the Analytics Engine below, each element requests specific pieces of data from the analytics API. Here is a breakdown of the fields and elements with a dropdown with their descriptions below.
query Analytics($filter: AnalyticsFilter) {
  analytics {
    series(filter: $filter) {
      period
      start
      end
      rows {
        metric
        unit
        dimensions {
          name
          path
          label
          description
          icon
        }
        value
        sum
      }
    }
  }
}
👉 Expand this dropdown to explore the list of fields and retrievable data..
In the provided GraphQL query, each field and element plays a specific role in determining what data is returned by the analytics engine. Here's a clear and concise description of each:
-
query Analytics($filter: AnalyticsFilter):This is the declaration of the query named 'Analytics', which accepts a variable$filterof typeAnalyticsFilter. This variable will be used to apply certain filters to the analytics data retrieved. -
analytics: This is the main query operation. It calls the analytics field on the GraphQL API. -
series(filter: $filter): This field represents a collection of data points or a data set that matches the criteria specified by the filter. It's an array of results, where each result is a time-bound statistical representation of the filtered data. And passes the$filtervariable as an argument to determine the scope of the data returned. -
period: Within each series, this field denotes the aggregation period for the data (e.g., monthly, quarterly, annually). It's a label describing the time span each series covers. start: This is the starting date and time of the data series, indicating when the period begins. -
end: This is the ending date and time of the data series, indicating when the period ends. -
rows: Represents the individual records or entries in the data series. Each row corresponds to a unique combination of dimensions for the specified period. -
metric: Within each row, this field specifies the particular metric being measured (e.g., budget, actuals, forecast). -
unit: This indicates the unit of measurement for the metric, such as quantities, currency (e.g., DAI), or percentages. -
dimensions: A nested array that provides context for the metric by breaking it down into finer categories or segments, such as 'project' or 'category'. Each dimension can contain:name: The identifier or key for the dimension.path: A structured representation of the dimension's hierarchy or location within a dataset.label: A human-readable label for the dimension, which can be used for display purposes.description: A brief explanation of the dimension to give users an understanding of what it represents.icon: A graphical representation or icon associated with the dimension for easier identification in user interfaces.
-
value: The actual numerical value of the metric for each row within the specified period. -
sum: A total or aggregated value of the metric over the entire period, providing a summarized figure.
This query structure allows users to extract detailed and summarized analytics data with it's context provided with the help of the the dimensions, tailored to specific time frames and measurements.
Filters
In the analytics engine, the filter object in a GraphQL query is crucial for tailoring the data retrieval to specific requirements. For the query to function correctly, a complete and fully structured filter object, containing all necessary parameters, must be used. Here's a guide on how to construct these filter objects and examples of different filter configurations.
Constructing a complete filter object
A filter object must include all the following parameters:
-
Start Date (
start): The beginning date of the data retrieval period. -
End Date (
end): The end date of the data retrieval period. -
Granularity(
granularity): Determines the aggregation level of the data (e.g., total, annual, monthly). -
Metrics (
metrics): A list of metrics to be analyzed (e.g., Budget, Actuals). -
Dimensions (
dimensions): Specifies qualitative data categories for segmentation, each with sub-parameters likename,select, and level of detail (lod).
In the analytics engine, dimensions play a critical role in segmenting and analyzing data. The select field within a dimension and its correlation with the level of detail (lod)
parameter are particularly crucial for tailoring your query to retrieve the most relevant and precise data. Here's a detailed explanation of their importance:
The select Field in Dimensions - Function: The select field specifies the exact segment or category within a dimension that you want to analyze. For example, in a dimension named "project," the select field could specify a particular project like "SES" or "Atlas." - Path Specification: The value set in the select field often represents a path in the data hierarchy. This path directs the query to focus on specific segments or nodes within the broader dimension category. - Precision in Data Retrieval: By setting the right path in the select field, you ensure that the query fetches data pertinent only to that specific segment, leading to more targeted and relevant insights. - Example: If you set the select field to "atlas/scopes/SUP/I/PHOENIX/" in the "budget" dimension, the query will retrieve data related to the budget allocated specifically for the "PHOENIX" project under the "SUP" scope in the "Atlas" system.
The level of detail (lod) Parameter - Granularity Within Dimensions: While the select field specifies what to select within a dimension, the lod parameter determines how detailed or summarized the information should be. - Hierarchy Levels: Different levels in lod represent different levels of detail in the data hierarchy. A higher lod value typically means a more detailed breakdown, while a lower value indicates a more summarized or aggregated view. - Correlation with select Path: The lod value you choose should correspond appropriately to the path specified in the select field. A mismatch might lead to data that is either too granular or too generalized than what is needed. - Impact on Analysis: The level of detail can significantly affect the analysis. For instance, a high lod can provide in-depth insights into a specific area, useful for detailed audits or close examination of a particular segment. Conversely, a low lod is better for broader overviews or when comparing larger categories.
Importance of Correct Configuration - Accuracy of Results: Setting the correct path in the select field and aligning it with an appropriate lod ensures the accuracy and relevance of the query results. Incorrect or mismatched configurations might lead to misleading insights or data that doesn't serve the intended analytical purpose. - Customized Analysis: Together, the select field and lod allow for a high degree of customization in data queries. Users can tailor their data requests precisely to their specific requirements, whether they need a broad overview or a detailed breakdown. - Follow the right upper or lower case letter style from metrics, granularity and dimensions.
- Currency (
currency): The currency format for the financial data (e.g., DAI, MKR).
The filter object can be created by using the UI menu from the graphql apollo studio explorer:
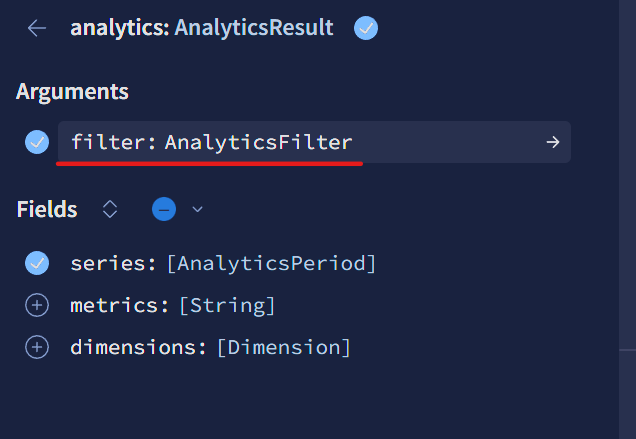 Select the filter
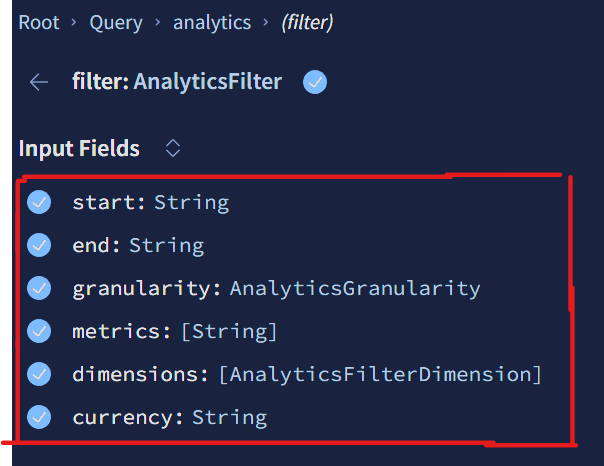 Select all filter fields and sub fields
Troubleshooting
Common issues
Mistyping the filter options or not using proper upper or lower case when necessary. Make sure to check this first when running into problems
Error messages
Usually, error messages are explicit and easy to understand what is wrong, below you can find some examples.
-
"message": "Cannot read properties of undefined (reading 'filter')", → There is something wrong with the filter options, make sure you've added all fields in the filter options. -
"message": "No valid metrics provided, make sure to use metrics from this list: Actuals, Budget, Forecast, FTEs, PaymentsOffChainIncluded, PaymentsOnChain, ProtocolNetOutflow", → A wrong format when adding metrics -
"message": "Variable \"$filter\" got invalid value \"Monthlyu\" at \"filter.granularity\"; Value \"Monthlyu\" does not exist in \"AnalyticsGranularity\" enum. Did you mean the enum value \"monthly\"?", → Granularity filter is mistyped.
If you are receiving error messages with status code of 500, reach out to the dev team.